


Gold
—











%0A$3,872.40/oz%20(up%20$16.90...)
Silver Breaks Below $50 and Gold Tests a 13-Month Low — What Two Scheduled Events Mean for Precious Metals This Week
TUESDAY, NOVEMBER 17, 2026 · ATLANTA, GA
ALEX LEXINGTON
THE DAILY MARKET INTELLIGENCE EDITION
MARKET SNAPSHOT
| Gold Spot (XAU/USD) | $3,872.40/oz (up $16.90, +0.44% from prior close) — partial Asia-session recovery from $3,832.20 overnight low, the lowest print since September 29, 2025; down approximately -15% from January 2026 peak |
| Silver Spot (XAG/USD) | $47.38/oz (up $0.40, +0.86% from prior close) — below the $50 psychological floor breached Friday; Gold/Silver Ratio at 81.7:1 near a one-year high |
| Gold/Silver Ratio | 81.7:1 — elevated versus Deutsche Bank's longer-term range of 60–65; widened from 81.4 Monday; above the historical 80:1 "silver undervalued" threshold |
| Brent Crude | $91.73–$92.67/bbl (down -0.77% from prior close) — Goldman Sachs flagging oversupply risk; bull-case target $96, bear-case target $88 |
| DXY (US Dollar Index) | 103.66 — 19-month high; highest since April 2, 2025; sustained mechanical headwind for non-yielding gold |
| 10-Year Treasury Yield | ~5.10% — eased modestly from last Thursday's 5.17% peak; primary opportunity-cost pressure on metals |
| S&P 500 (SPY) | $736.66 pre-market (down -0.44% from prior close) — Nasdaq Composite -2.49% on Nvidia AI-sector drag ahead of tonight's earnings; VIX at 22.91, above the 20 stress threshold |
| VIX | 22.91 (session range 22.36–24.19) — above the 20 stress threshold, elevated fear environment; not yet at the 25+ systemic acceleration zone |
Gold opened its Tuesday session at $3,859.50 on December futures — the lowest futures open since September 29, 2025 — before Asia-Pacific buyers stepped in to push spot back toward $3,872. COMEX open interest stands at approximately 399,169 contracts, up 0.6% week-over-week, while volume at roughly 33,360 contracts sits well below the typical active-session average of 100,000-plus, according to CME Group and Investing.com data. That combination — rising open interest with still-compressed volume — is consistent with continued short positioning in the derivative channel rather than fresh institutional conviction on either side. CME FedWatch now prices a 100% probability of a December rate hike: 95.7% pricing a 25-basis-point move and 4.3% pricing a 50-basis-point move, leaving zero probability of a hold at the December 9 FOMC meeting. That repricing, alongside a DXY at a 19-month high and the 10-year Treasury near 5.10%, has been the mechanical engine behind the -15% compression in gold from its January 2026 peak. October retail sales released this morning at 8:30 AM ET added to that pressure — headline came in at +0.2% versus a +0.1% consensus, and core printed +0.6% against a +0.4% forecast, extending a 13-consecutive-month streak of positive retail growth per National Retail Federation data.
---
MARKET CONTEXT
The story this week is not simply that gold is down. It is that two markets are telling two very different stories at the same moment, and both are correct.
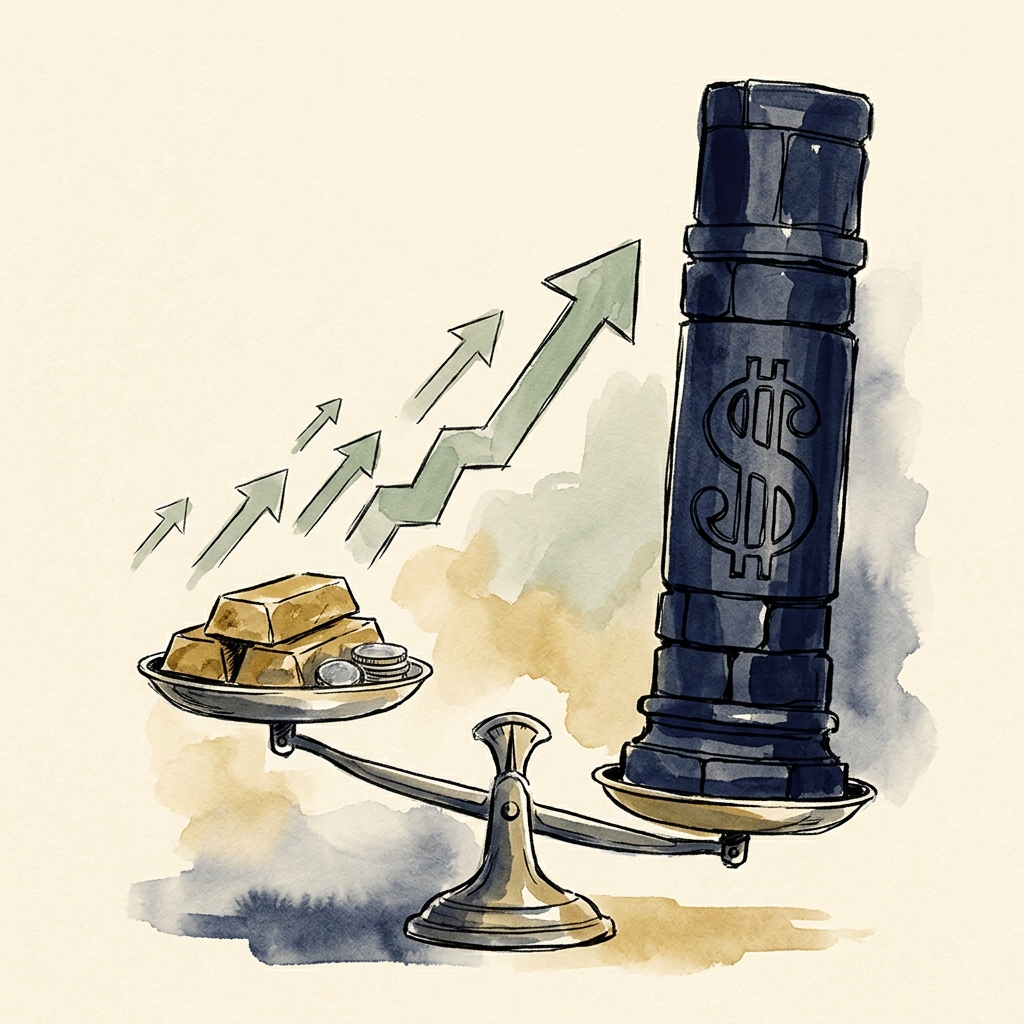
The derivative channel — paper gold, ETF flows, Western futures positioning — has absorbed a punishing repricing over the past five sessions. Gold is down approximately 7% in a week and 15% from January's peak. Silver broke decisively below $50 on Friday and failed to reclaim it through Monday's -4% session. GLD closed November 16 at $352.93, sitting below any recent support level worth naming. The dollar at a 19-month high and 10-year yields near 5.10% are real costs for anyone holding non-yielding assets, and the market is pricing that reality with precision.
Then there is everything else. The People's Bank of China added 26 tonnes to its reserves in October — the 24th consecutive month of buying — bringing its total to 2,435 tonnes, according to World Gold Council reporting. That streak now spans two full years without interruption. The World Gold Council's Q3 2026 Demand Report, released November 3, recorded central bank net purchases of 321 tonnes for the quarter, up 42% year-over-year against a five-year quarterly average of 227 tonnes. Year-to-date 2026 gold demand sits at approximately 3,880 tonnes — matching the record pace set in 2025 and valued at roughly $566 billion. India, which had been trading gold at a $21-per-ounce discount to London as recently as October, flipped to a $1.50-per-ounce premium in November as festive season demand pushed imports to a five-month high of approximately 71 tonnes — a 78% month-over-month surge, according to FX Street and Gulf News reporting. Perth Mint's November coin and minted bar sales rebounded to 66,710 ounces from October's 32,933 ounces, essentially doubling as retail buyers in the Asia-Pacific region responded to the lower price. And in Hong Kong, gold traded at HK$30,474.30 per ounce (+0.71% over 24 hours), marginally outperforming London's sterling-denominated equivalent of £2,937.28/oz (+0.42%) — the kind of regional price divergence that shows up when physical buying is active.
This is what the Gold/Silver Ratio at 81.7:1 is telling us in structural terms. Silver's industrial demand story — solar panels, EV electronics, 5G infrastructure, AI data center power requirements — does not change because CFTC speculative positioning has washed out to a near-extreme of only 3,321 net long contracts on 116,226 open interest, per the October 27 Commitments of Traders report. The Silver Institute projects a sixth consecutive annual supply deficit of 46.3 million ounces for 2026. Perth Mint's November silver coin sales reached 875,487 ounces. Physical buyers are showing up at $47. The derivative channel and the physical channel are, at this moment, priced very differently.
The Dubai Precious Metals Conference convened today, November 17, with the DMCC announcing that a wholesale digital gold collateral pilot for the UAE is imminent — a signal that Middle Eastern physical market infrastructure continues to evolve well beyond this week's spot price. And Bundesbank President Nagel, speaking at LBMA 2026, made the institutional case for gold directly: central bank gold reserves as a share of global holdings have risen from 14% to 25%. These are not the words of an institution that views this week's spot price as the defining data point.
---
MAVERICK TRADING JOURNAL
No new position today — and this is a decision that the market itself made straightforward.
Two significant events land within the next 30 hours: Nvidia reports Q3 earnings tonight after the close, and the Federal Reserve releases the minutes from the October 27–28 FOMC meeting tomorrow at 2:00 PM ET. The approach here is not to position ahead of binary unknowns. Nvidia has shed approximately 30% of its market capitalization from its October peak — dropping from roughly $5.77 trillion to $4.07 trillion — and the VIX sits at 22.91, above the 20 stress threshold. A weak earnings print tonight specifically risks triggering the kind of AI-sector equity rout that cascades into forced gold liquidations. When that happens, it looks like safe-haven demand collapsing — but it is actually margin calls driving the action. Those two things require different responses, and they are indistinguishable until after the fact.
The FOMC Minutes carry their own asymmetry. With December hike probability cemented at 100%, the composition of hawkish dissent in the October meeting notes carries outsized weight. A hawkish-skewed read extends the DXY pressure that has driven the -15% compression from January's peak. A more nuanced read could trigger a sharp relief rally in conditions that are, structurally, deeply oversold. Neither outcome is predictable from today's positioning, and trying to call it would be guesswork wearing the costume of analysis.
There is also the matter of an open SLV position, carried since March 31 at a silver-spot reference entry of $64.03. At today's $47.38, that position sits approximately $16.65 below entry — roughly -26.00% on the spot-reference frame, and the deepest drawdown of its lifetime. Silver's modestly green day (+0.86%) is a partial recovery from Monday's -4% session, not a structural reversal. Adding fresh silver-side exposure on top of an open position at this drawdown level would be stacking risk in the same direction at the wrong moment.
On gold's side, Friday's stop-out on the GLD call position is two sessions old. GLD closed Monday at $352.93 — $1.96 below Friday's exit price of $354.89, and well below the prior $358 stop level. The technical wrapper has not stabilized above where the trade exited. Chasing a re-entry against that backdrop, before FOMC Minutes have cleared, would not be discipline. It would be emotion dressed as analysis.
The patience here has a specific endpoint: Wednesday afternoon, after the FOMC Minutes have dropped and the Nvidia reaction has registered. What the framework is watching for then is a move of meaningful size in either metal — the kind of single-session range that confirms direction rather than oscillates within the recent compression. Until that signal arrives, the correct position today is no position.
---
THE TAKEAWAY
Asia bought the dip overnight. London confirmed the bounce. The US session opens into a retail sales beat, a 19-month dollar high, and two binary events within 30 hours.
Today's spot configuration reflects the full weight of a hawkish rate cycle pressing against two metals that remain structurally supported by physical demand that neither headlines nor rate hike probabilities fully capture. Gold at $3,872 is down approximately 15% from January's peak, reaching levels last seen in September 2025. Silver at $47.38 sits below the $50 floor it broke through last week, with the Gold/Silver Ratio above 80 for the first time in nearly a year. Those are the numbers on the derivative-channel side of the ledger.
The other side: central banks bought gold for the 24th consecutive month. India flipped from a discount to a premium. Perth Mint's November coin sales doubled October's figures. The Silver Institute projects a sixth straight year of supply deficits. The CFTC's most recent data shows silver speculative positioning at a near-washed-out extreme of 3,321 net long contracts — the kind of positioning floor that has historically preceded a mean-reversion move higher. These are physical flows, documented and ongoing. They do not appear in this week's spot price.
The framework observation on this configuration: two channels are pricing the same metal very differently. The derivative channel is processing today's hawkish macro data in real time — retail sales beat, dollar at 19-month highs, yields near 5.10% — and the price reflects that. The physical channel is processing the same data as an accumulation window, with sovereign buyers, Asian retail buyers, and import markets all indicating demand at or near current levels. Both channels are rational. They are operating on different time horizons.
What happens to the near-term price depends significantly on what the FOMC Minutes say tomorrow and what Nvidia's earnings reveal tonight. Those are the two inputs worth watching before any fresh directional read. The structural picture — the ratio, the positioning data, the supply deficit, the sovereign buying streak — does not change based on either. But the derivative channel certainly will react.
Three generations in this business have produced one reliable observation: the moments that feel most like "wait and see" are often the ones where the structural setup is building most quietly. At Alex Lexington, that is what this week looks like. The sovereign and physical channels are not waiting.
---
DISCLOSURE
This content reflects disclosed trading activity and market analysis for educational purposes. Alex Lexington does not manage client funds or provide personalized financial advice. Past performance does not guarantee future results. Always consult a licensed financial advisor before making investment decisions.---
Read more
After the Bell: Gold hits a 13-month low as Fed hike bets lift the dollar
Gold slipped to around $3,856 and silver fell almost 4% as markets priced a December Fed rate hike and the dollar climbed. Here's what moved, what it means for borrowing, the pump and your metals, ...
Read more
After the Bell: Gold holds near a one-year low as silver bounces
Gold slipped about 0.3% to around $3,845 an ounce, holding near a 13-month low as December Fed hike bets keep the dollar strong and yields near 5.1%, while silver bounced about 0.8% to $47.30. List...
Read more